In collaboration with the National Institute of Chemistry in Ljubljana, Mebius has developed a Pt-skin over structurally ordered Cu3Pt alloyed core-shell type catalyst. These types of catalysts are only just now being developed by the rest of the industry, in turn, we have already completed testing of the catalyst operation under various conditions and the NIC has begun the process of scaling up manufacture from 20g per batch, to over 200g per batch.
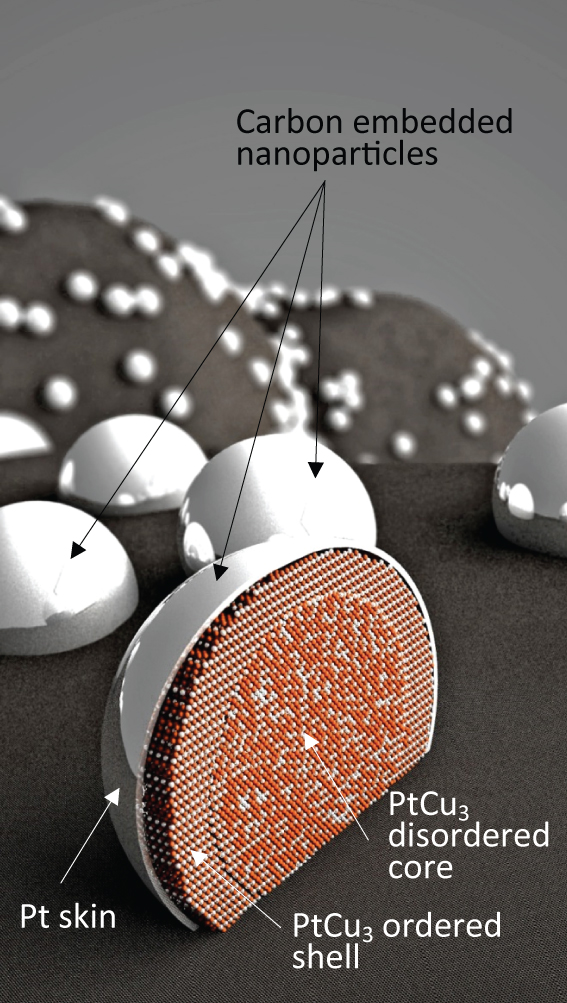
Cross-section view of the Pt-skin over the ordered PtCu3 (intermetallic) shell catalyst nanoparticle embedded in graphitized carbon, artist's impression by Jaka Birsa.
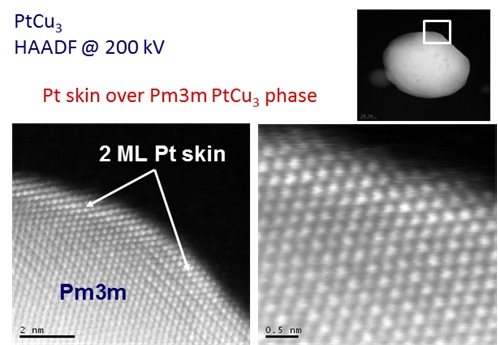
EM tomography of PtCu3 nanoparticle showing the 2 monolayer Pt-skin over ordered (Pm3m) shell. (Courtesy of National Institute of Chemistry, Ljubljana)
There are huge benefits in being able to manipulate platinum distribution within a particle to this degree, with only a few layers of Pt atoms covering the structurally ordered PtCu3 core. All of the Pt present in the skin is thus available for the electrocatalytic reaction. Consequently there are no longer limitations as to the nanoparticles size distribution (see image below). Thus one avoids the so-called particle size effect on catalytic activity, which allows us to avoid small nanoparticles and narrow particle size distribution necessary for ordinary Pt/C catalysts to obtain high enough electro-catalyticaly active surface area (ESA). Although the ESA in our catalyst is lower (between 20 and 40 m2/gPt) the specific and mass activities are much higher than for ordinary Pt/C catalyst.
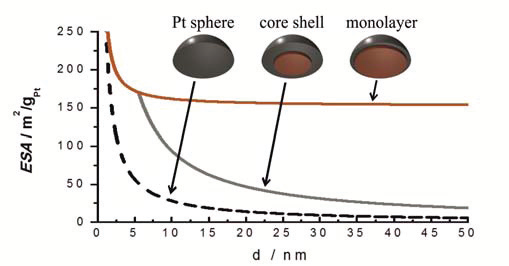
Image above: dependence of electro-catalytically active surface area (ESA) of the catalyst on particle size for three different types of catalysts: pure Pt nanoparticles (Pt sphere), core-shell Pt alloyed catalysts (core-shell), and Pt-skin catalysts (monolayer).
Another benefit of Pt-transition metal alloyed catalysts is their increased activity, due to strain and/or ligand effect. However, in the case of our proprietary catalyst this activity is nearly doubled in comparison with similar Pt-transition metal alloyed catalysts due to structurally ordered shell beneath the Pt skin present in our catalyst.
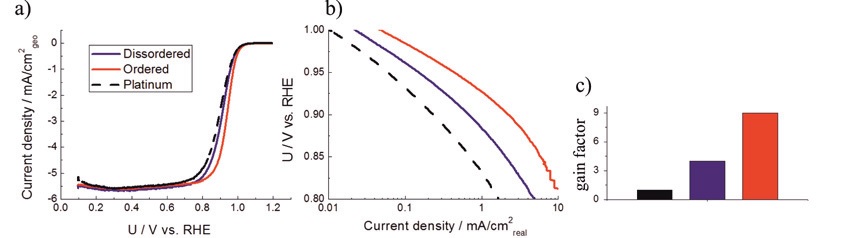
ORR polarisation curves in 0.1 M HClO4 at rotation of 1600 RPM with 20 mV/s of Pt/C and two PtCu/C catalysts (black is platinum, blue is disordered and red is ordered), b) are Tafel plots and c) are gain factors normalized to Pt/C specific activity at 0.9 V
MOR polarisation curves in 0.1 M HClO4 and 1 M methanol at rotation of 1600 RPM with 50 mV/s of Pt/C and two PtCu/C catalysts (black is platinum, blue is disordered and red is ordered), b) are Tafel plots and c) are gain factors normalized to Pt/C specific activity at 0.9 V. In the polarisation tests above the MOR was measured on the same catalyst films and in the same electrolyte as ORR. (Source article)
A recent study of our catalyst's stability and degradation characteristics provided excellent results, showing that the Cu3Pt catalyst does not suffer from Oswald ripening (a phenomenon common to all comercially available PEM catalysts at this time – Wikipedia article), and it also does not suffer nanoparticle detachment from the substrate, nor is it affected by carbon corrosion under various electric potential protocols of testing (potential cycling or potential hold). This has been demonstrated by using the so-called identical location transmission (IL TEM) and scanning (IL SEM) electron microscopies.(Source article)
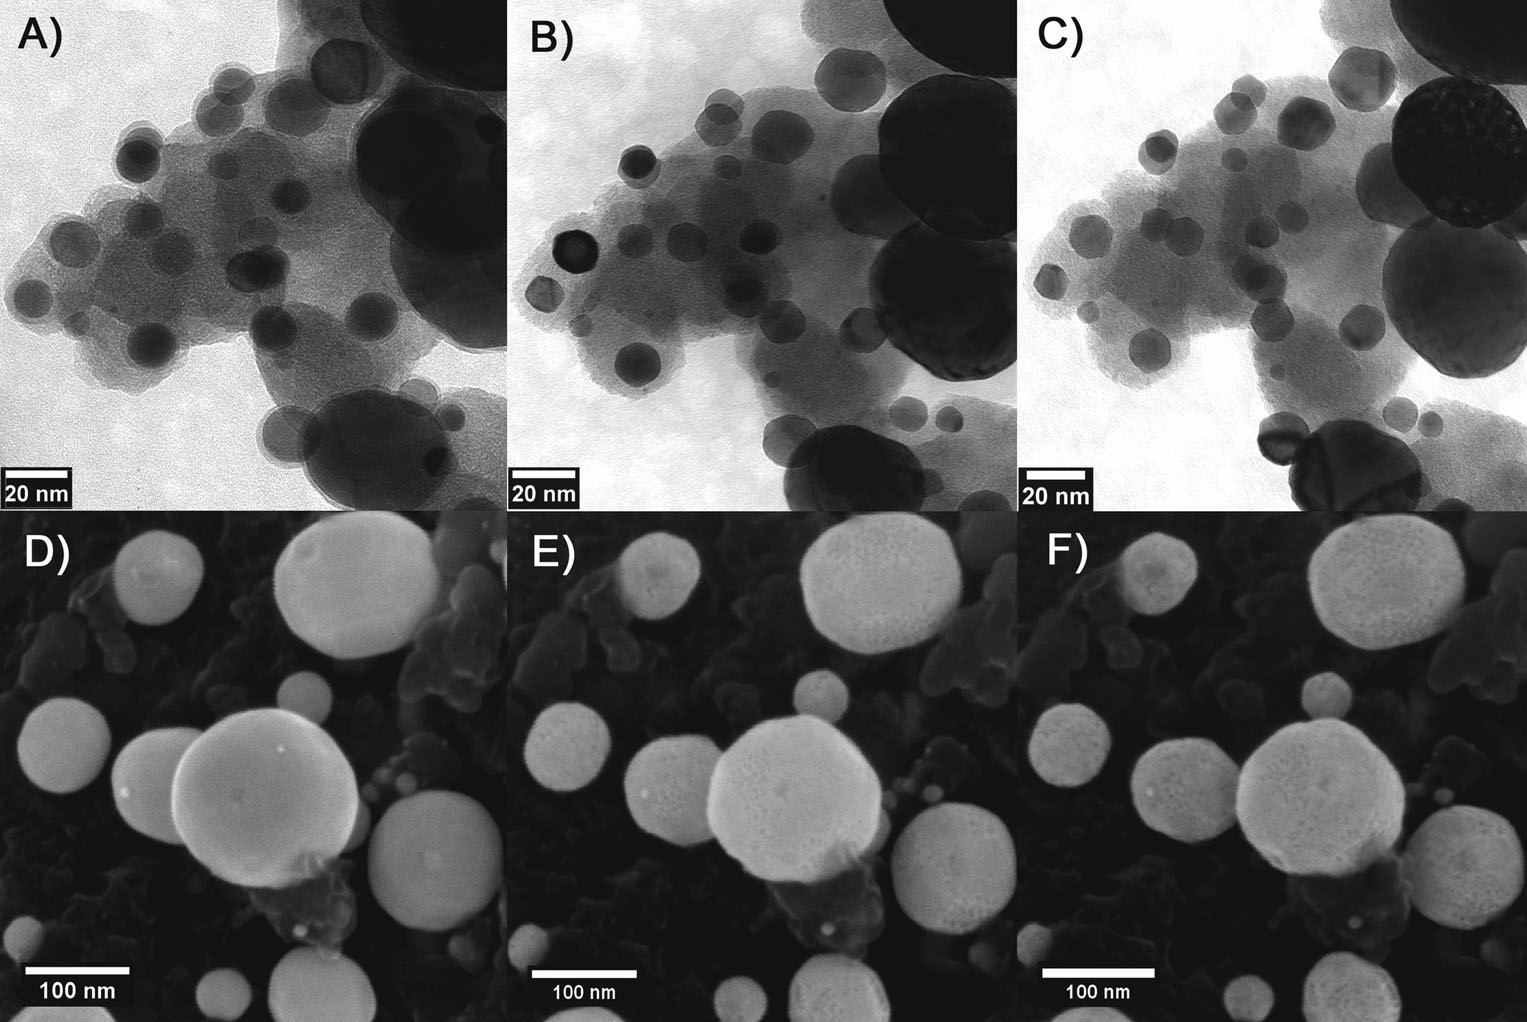
IL-TEM micrographs of the PtCu/C nanoparticles: A) as-annealed, B) after 500 dealloying cycles (0.2 Vs-1 between 0.05 and 1.2 V), and C) after 7000 degradation cycles (1 Vs-1 between 0.6 and 1.2 V). IL-SEM micrographs of the same catalyst: D) as-annealed, E) after 500 dealloying cycles, and F) after 5000 degradation cycles. (Source article)
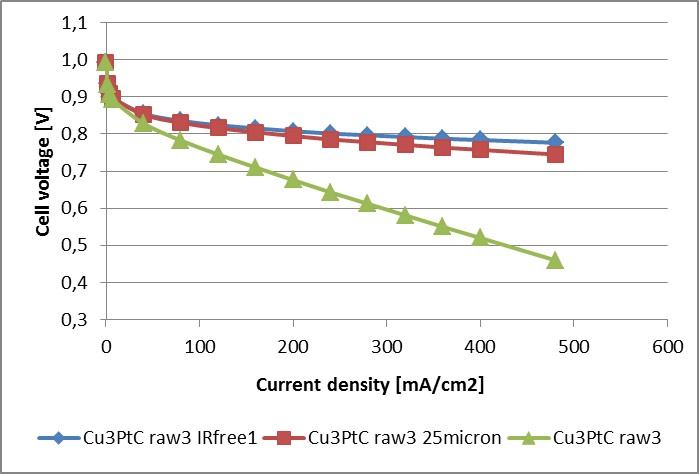
The as-synthesized catalyst from 20 g synthesis batch was used to prepare the catalyst ink, ink-jet deposited on wet proofed carbon cloth (GDL-CT, FuelCellsEtc) to obtain GDEs and then hot-pressed with Nafion® 115 membrane in H+ form to obtain 5x5 cm2 active electrode area MEAs. These MEAs were tested in single cell on CompuCell GT test station (QuinTech GmbH, (ElectroChem Inc.)) at 65C and 80% RH of fed gases on both electrodes. The obtained polarisation curves in different coordinates are presented in the graphs below.
Polarisation curves recorded in single-cell tests with Nafion 115 membranes, 0.1mg/cm2 PtCu (20% wt) GDE loading (identical anode and cathode), measured at 65 degrees Celsius and 80% RH, in comparison with IR corrected, and calculated Nafion 211 resistance values plotted on a curve. The right image shows polarisation curves with current densities expressedin the units of A per mg Pt present on the cathode.
The results are presented below, where the polarisation curve on the described MEA is confronted with the polarisation curve on MEA prepared from a commercial GDE with Pt/C catalyst having platinum loading of 0.5 mgPt/cm2geom and Nafion® 115 membrane. It is obvious that even in realistic conditions the MEA with Pt-skin over Cu3Pt/C catalyst is about six times more active than the MEA with commercial Pt/C catalyst electrodes at 0.6 V versus RHE.
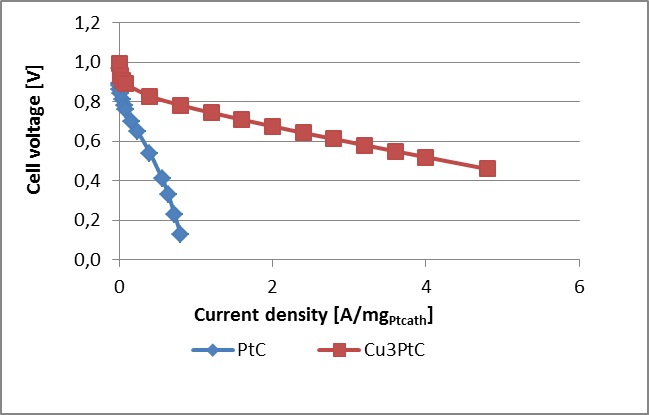
Comparison of polarisation curves obtained with commercial Pt/C electrocatalyst and with Pt-skin over structured PtCu3/C catalyst when current densities expressed in the units of A per mg Pt present on the cathode.
For pricing and lead-time information, please contact us here.


Mebius d.o.o.
Mašera Spasića 8
1000 Ljubljana
SLOVENIA
Phone: +386 (0)41 990 500
Email: info@mebius.si
Headquarters: Ljubljana